Daily Market Analysis
Market Focus
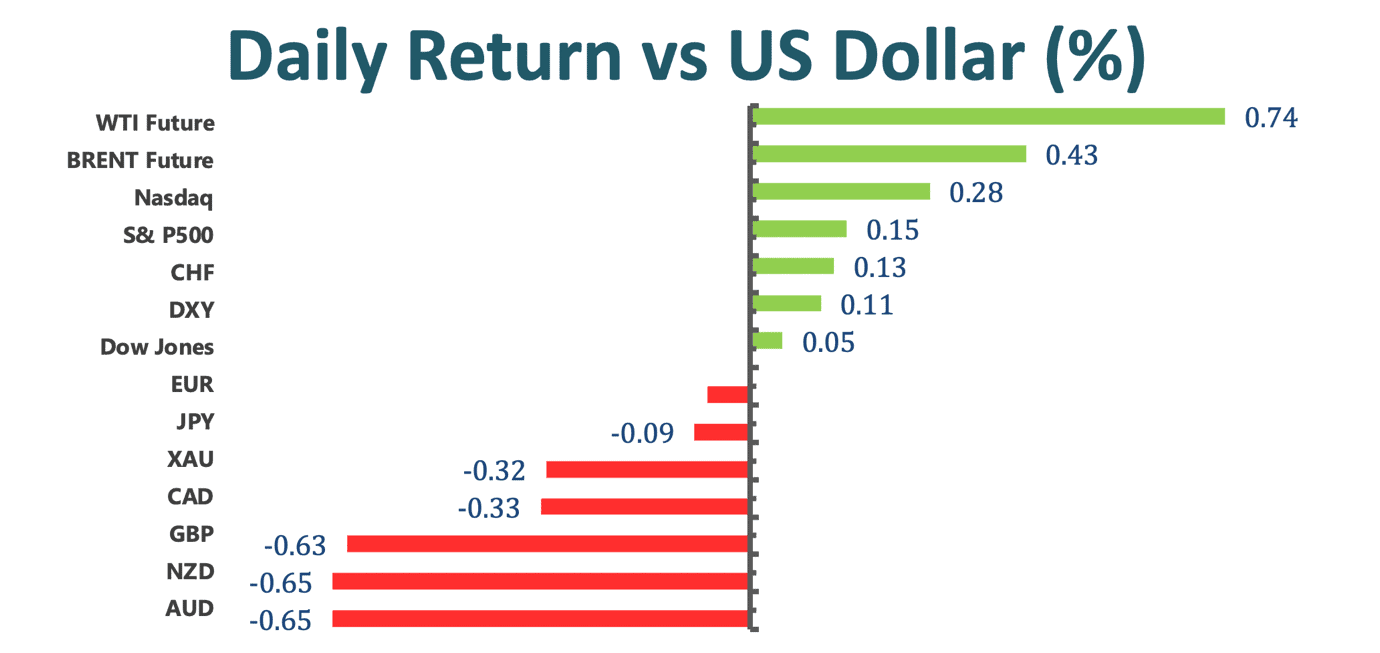
Stocks markets were a little green after the Fed Reserve refrained from signaling any changes to its bond- buying program, causing the dollar index advance. All told, the Dow Jones Industrial Averages climbed about 0.05%; the S&P 500 rose 0.15% while the Nasdaq crawled 0.28%. The credit markets are pondering over whether if yields are going up because the economic is reopening and massive real growth is expected or if yields are going up because of inflation. If it is the former one, the stock markets will not be bothered; however, if it is the latter one, there will be a problem for the economy, according to Jim Bianco, president of Bianco Research.
Key takeaways from the FOMC:
Treasury Secretary Janet Yellen unveiled a detailed pitch for Joe Biden’s new corporate tax code, planning to recoup $2 trillion in overseas profits. Yellen stated that a new tax code would be fairer to all Americans, removing incentives for companies to shift investments and profits abroad, and at the same time raising more money for critical needs at home. All told, the extra tax takes of about $2.5 trillion over 15 years would pay for Joe Biden’s eight- year infrastructure, green investments, and social program spending.
Asian stocks markets were mixed as Thailand and Hong Kong led declines while most other equity benchmarks advanced. Thailand SET index plunged the most amid a domestic surge in coronavirus infections. Restaurant and hotel shares led the decline as the Prime Minister mentioned that a tougher restriction would be imposed in an effort to fight the virus.
Market Wrap
Main Pairs Movement:
GBPUSD has slipped below 1.38, extending further south as US yields resume their gains. The pair fell more than 0.6% amid doubts about Boris Johnson’s plan to reopen the country. Moreover, despite of having upbeat data, GBPUSD seems to depend heavily on movements in US bond yields, resulting in a negative move in the pair today. On the other hand, optimism from the Fed Reserve poses a risk to GBPUSD’s gains.
Gold declines after the FOMC, provided no tailwinds for the metal. The Fed Reserve saw it taking some time before conditions would be met for scaling back massive monthly asset purchases. At the same time, investors continued fleeing from gold- backed exchange traded fund, showing a bearish sign. Gold has been under the downside pressure this year amid the increasing optimism over the post- pandemic economic recovery worldwide.
The US dollar index got lifted as the Fed Reserve have shown no rush to taper assets purchases; the Fed remained optimistic on the economic impact from fiscal stimulus and vaccinations. With these, the US 10-year yield rose about 1.4%, strengthening the US dollar index.
USDCAD climbed around 0.4% as the US dollar put options worth $750 million against the Canadian dollar at 1.26 strike price, which will expire on the 9th of April.
Technical Analysis:
GBPUSD (Four- Hour Chart)

The British Pound trades near daily low around 1.3737 against the US dollar as the time of writing. The bearish trend is mostly confirmed as GBPUSD has extended its slump below its simple moving averages. Moreover, the support level at 1.3749 has been broken, giving the pair more room to accelerate the bearish momentum. Furthermore, the technical indicators, the MACD maintains its downward strength, lending support to bears, whilst the RSI has not yet fully reached the oversold readings. As of now, the next target for GBPUSD is expected to be heading toward 1.3670, the next immediate support.
Resistance: 1.3749, 1.3798, 1.3838
Support: 1.3670
USDJPY (Daily Chart)

USDJPY continues to trade in the price range of 109.70- 110.97. The pair is in the stage of determing which side to go as it is currently testing the critical support level at 109.70, where the 20 SMA and the ascending trend cross. On the upside, if USDJPY fails to break though the support level, then it will bounce back to the bullish channel, suggesting a continuous positive move. To the downside, if USDJPY successfully breaks through the support, it is expected to accelerate the downside pressure toward the next support at 108.99; moreover, a near overbought RSI also lends support to bears. That being said, the pair needs to break below 109.70 to confirm another leg south.
Resistance: 110.97
Support: 109.70, 108.99, 107.77, 106.78
XAUUSD (Daily Chart)
Gold trades in a relatively tight range today on the day of FOMC, trading at $1740 as the time of writing. Gold once again clinges on the immediate resistance at $1746.91. In the near- term, bullish momentum is expected to happen, helping gold break through the resistance level as it is the 7th time that gold retests the level. To the upside, the MACD indicator currently lends support to bulls whilst the RSI is still outside of the overbought region, giving gold a room to trade higher. Above $1746.91 and futher above the 50 SMA, gold will see a near- term base established for a deeper recovery to $1790.23, a fresh cap.
Resistance: $1746.91, $1790.23, $1825.24
Support: $1676.89
Economic Data
|
Currency |
Data |
Time (GMT + 8) |
Forecast |
||||
|
USD |
FOMC Meeting Minutes |
02:00 |
N/A |
||||
|
GBP |
Construction PMI (Mar) |
16:30 |
54.6 |
||||
|
EUR |
ECB Monetary Policy Statement |
19:30 |
N/A |
||||
|
USD |
Initial Jobless Claims |
20:30 |
680K |
||||


